


 Price Prediction & Analysis: Network Usage Soars as Token Eyes $200")
TLDR
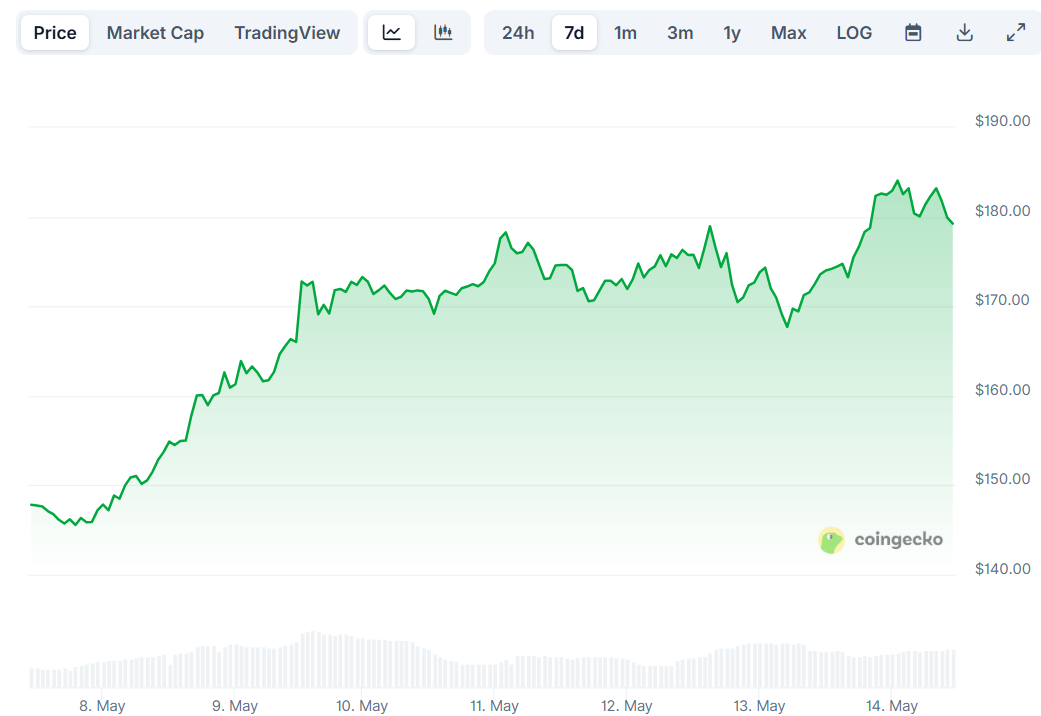
- SOL price has jumped 22% in one week, now trading at $180
- DeFi Total Value Locked increased to $9.6B from $7.5B this month
- Traders taking short positions with long/short ratio at 0.86
- Solana leads all blockchains with $22.4B in weekly DEX volume
- Technical indicators show overbought conditions with resistance at $185
Solana’s price has been on an upward trajectory, now hovering around the $180 mark. This represents the highest price point for SOL since February 2025.
The token has gained 6% in the last 24 hours alone. Over the past week, SOL has surged by 22%, drawing attention from traders and investors alike.
Data from Coinglass shows Solana’s open interest has increased by 11.08%. This metric indicates new money flowing into SOL trading contracts, typically a sign of market confidence.
The DeFi ecosystem on Solana has been thriving in May. Total Value Locked (TVL) has expanded from $7.5 billion at the start of the month to $9.6 billion now, according to DeFiLlama.
Several projects are driving this growth. Marinade has seen a 56% increase in TVL. Jito has grown by 41%. Raydium has experienced the largest growth at 78%.
Weekly trading volumes on Solana-based decentralized exchanges have also improved. Last week saw $22 billion in volume, up from $18 billion the previous week.
Network Performance Remains Strong
On-chain metrics for Solana continue to show health. Both revenue and transaction fees have increased for four consecutive weeks, reaching levels not seen in three months.

Currently, 65% of all SOL tokens are staked. This reduced circulating supply, combined with growing demand from DeFi users, creates favorable conditions for price growth.
Not all metrics are positive for Solana. The network’s stablecoin market cap has dropped by 8% over the past week, now standing at $11.7 billion.
The funding rate for SOL stands at 8%. This means traders are paying premium fees to maintain long positions. While this shows market optimism, such high rates often come before price corrections.
Solana has become the dominant blockchain for DEX activity. Its weekly volume of $22.4 billion surpasses Ethereum by more than $6 billion. Other networks like BSC, Base, and Arbitrum trail even further behind.
The combination of fast transactions and low fees has made Solana attractive for traders, memecoin launches, and liquidity providers.
Market Sentiment and Technical Analysis
Despite strong fundamentals, trader sentiment appears to be shifting. The long/short ratio for SOL has dropped to 0.8653, its lowest point in 30 days.
This means short positions (53.61%) now outweigh long positions (46.39%). This bearish positioning comes at an unusual time when network usage metrics remain strong.
Technical indicators for SOL present a complex picture. The cryptocurrency trades above all major moving averages, with 10, 20, 50, 100, and 200-day averages all signaling “buy.”
However, the RSI reading of 71.83 suggests overbought conditions. This may limit further upside in the short term without a cooling-off period.
The Bollinger Bands for SOL are widening. With the price near the upper band at around $185, this indicates high volatility and possible consolidation ahead.
SOL faces resistance at the $185 level. Breaking through could open a path to the $200 price target. On the downside, support exists at $170, with stronger support at $157 and $130.