


 Price: Can Retail Enthusiasm Overcome Whale Profit-Taking?")
TLDR
- PEPE surged 84% in recent days, pushing its market cap to $5.9 billion
- Price action has formed a double top pattern at the $0.000015 level
- Whale transactions increased by 257% on May 12, reaching 720 large transfers
- PEPE remains the third-largest memecoin, behind only DOGE and SHIB
- Despite pullback, 72% of traders on Binance maintain bullish long positions
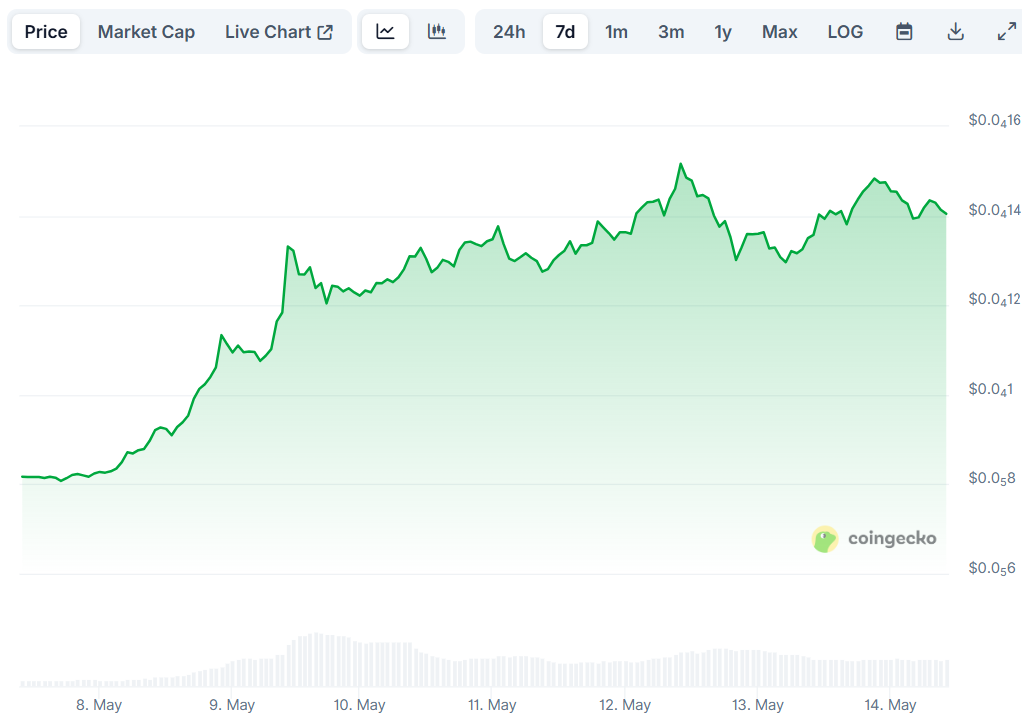
PEPE has experienced a slight pullback after its remarkable surge last week. Trading at $0.00001399, the token is down 3.19% in the last 24 hours, a cooling off period that follows an impressive 84% rise over the past few days.
This price movement comes as the overall memecoin sector continues to heat up, with total market capitalization growing from $55 billion to $72.2 billion in less than two weeks.
The recent price action in PEPE has formed what technical analysts describe as a double top pattern, with two failed attempts to break above the $0.000015 psychological barrier.
This technical formation often signals potential exhaustion in buying momentum and may hint at a forthcoming correction.
On-chain data reveals an interesting development that supports the cautious outlook. Whale transactions, defined as transfers exceeding $100,000 in value, spiked dramatically by 257% on May 12.
The number of these large transactions reached 720 on that day, coinciding exactly with PEPE’s price peak at $0.000015.
Market Dynamics Show Mixed Signals
Historical patterns suggest that when whale transaction counts approach or exceed 800 after a strong uptrend, it often indicates large holders are taking profits.

Previous instances of this behavior in May, November, and December 2024 were followed by price corrections.
Despite these warning signs, retail enthusiasm remains strong. PEPE’s holder count has grown to over 432,000 addresses, suggesting continued grassroots support for the token.
The coin’s journey over the past month has been nothing short of spectacular. Starting from around $0.0000075 on May 6, PEPE doubled in value to reach $0.000015 by May 12.
This growth has cemented its position as the third-largest memecoin by market capitalization, trailing only the industry giants Dogecoin (DOGE) and Shiba Inu (SHIB).
PEPE’s market cap expansion from $2.4 billion in March to its current $5.9 billion demonstrates the explosive growth potential of popular memecoins during favorable market conditions.
Technical Indicators Point to Potential Pullback
Technical analysis of PEPE’s price chart reveals several concerning indicators for short-term holders.
The Relative Strength Index (RSI) shows a bearish divergence, declining from overbought territory toward the midpoint while the price attempted to maintain its uptrend.
The MACD indicator has formed a negative crossover, with both the MACD and signal lines trending lower, suggesting increasing bearish momentum.
If PEPE breaks below the $0.00001274 support level, technical projections estimate a potential 25% decline toward $0.00001063.
However, this bearish scenario would be invalidated if buyers push the price above the $0.000015 resistance level.
Current RSI readings stand at 84.16, placing PEPE firmly in overbought territory. This condition typically precedes consolidation periods, which can be healthy during strong upward trends.
Trader Sentiment Remains Bullish Despite Warning Signs
Derivatives market data tells an interesting story about trader sentiment. Despite the technical warning signs, 72% of PEPE traders on Binance maintain long positions.
This has pushed the long/short ratio to 2.57, indicating strong bullish sentiment among retail traders.
Open interest remains near record highs at $583 million, showing sustained trader engagement with the token.
However, in the past 24 hours, PEPE’s trading volume has dropped by over 20%, and open interest has declined by 11.42%.
This cooling activity has resulted in more than $4.71 million in long position liquidations, suggesting some traders are beginning to take profits or get stopped out of positions.