


 Price: Technical Indicators Turn Bullish, What’s Next?")
TLDR
- DOGE experienced a 10% price drop, touching $0.217 before recovering to $0.227
- Over $22.5 million in liquidations occurred with $19 million from long positions
- Currently ranks as 8th largest crypto with $33.7 billion market cap
- Technical charts show a bullish trend line forming with support at $0.235
- Price may target $0.265 if it can overcome the $0.245 resistance barrier
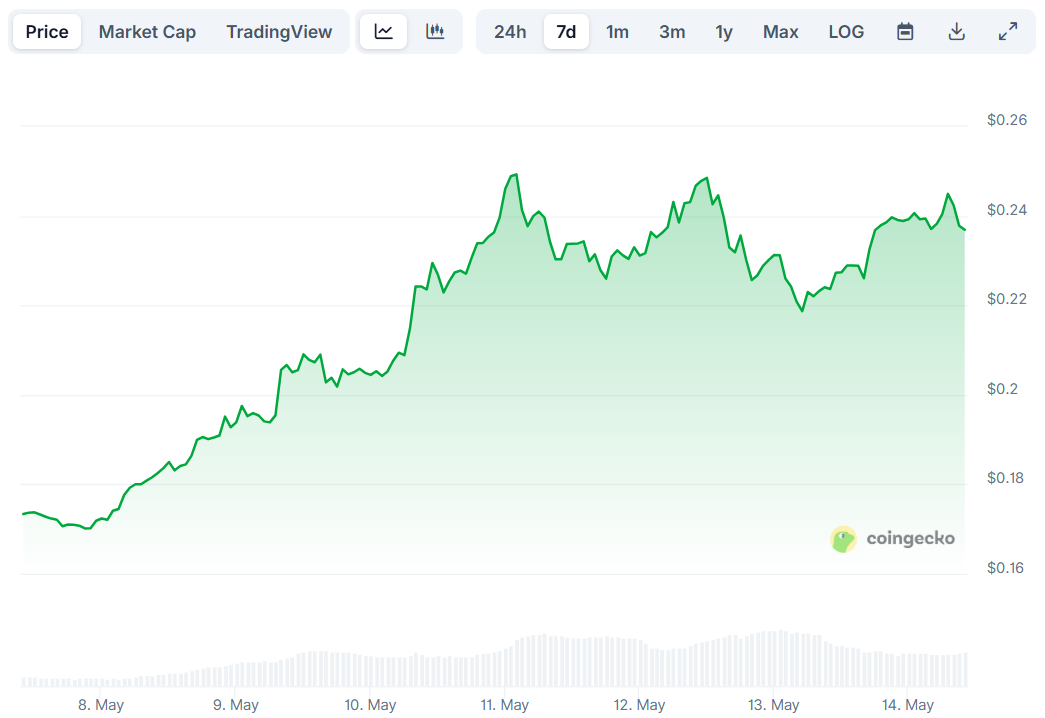
The popular memecoin Dogecoin has been on a rollercoaster ride this week, first climbing above $0.25 before experiencing a sharp 10% correction. Market data shows DOGE plummeted to a low of $0.217 before finding support and bouncing back to the $0.227 level.
This price action placed DOGE among the worst performers in the top cryptocurrency rankings over the past 24 hours. However, zooming out to a weekly timeframe tells a different story, with the coin still boasting gains of more than 34% over the past seven days.
The recent price drop triggered a wave of liquidations across derivatives exchanges. According to data from CoinGlass, Dogecoin saw $22.5 million worth of contracts liquidated in a single day, ranking fourth in total liquidation volume across the entire crypto market.
Long traders were hit particularly hard, with over $19 million in long positions being forcefully closed as prices declined. This liquidation volume, while substantial for DOGE, was still overshadowed by Bitcoin and Ethereum, which experienced $154 million and $136 million in liquidations respectively.
Dogecoin currently maintains its position as the eighth-largest cryptocurrency by market capitalization. With a market cap of $33.7 billion, it continues to rank ahead of Cardano in the top cryptocurrency rankings.
Price Analysis
After the sharp decline, DOGE appears to be finding its footing around the $0.227 level. The price found strong support near $0.217, allowing bulls to stage a recovery above the $0.225 resistance zone.
Chart analysis shows that buyers have pushed the price above the 50% Fibonacci retracement level calculated from the recent downward move that took DOGE from $0.2531 to $0.2173. A bullish trend line has formed with support visible at $0.235 on hourly charts.

The price is now trading above both the $0.235 level and the 100-hour simple moving average, which many traders view as a positive technical development. This positioning could serve as a foundation for further upward movement.
The immediate resistance on the upside appears at $0.240. Beyond that, a more critical resistance zone exists near $0.244, coinciding with the 76.4% Fibonacci retracement level of the recent downward move.
#Dogecoin is attempting to break the Bull Flag pattern, setting a target at $0.37 🔥$Doge pic.twitter.com/aqYIuSuRGq
— Trader Tardigrade (@TATrader_Alan) May 13, 2025
Should buyers manage to push prices above this zone, the next major resistance would be at $0.253. A successful close above this level could potentially open the path toward the $0.265 zone, with further targets at $0.272 and $0.285.
Technical indicators are starting to lean bullish. The MACD for DOGE/USD is gaining momentum in the positive zone, while the Relative Strength Index (RSI) has climbed above the 50 level, suggesting increased buying interest.
However, the recovery is not guaranteed. If DOGE fails to break above the $0.244 resistance level, another decline may unfold. In such a scenario, initial support would be found near $0.235, with stronger support around $0.225.
The critical support level sits at $0.215. A break below this level could trigger further selling, potentially pushing prices down to test the $0.20 level or even drop to $0.188 in the near term.