TLDR
- TON is trading in a bullish pennant pattern around $3.29-$3.50
- Whale activity has spiked 84%, reaching $6.12 billion in large transactions
- A $999K liquidation cluster at $3.66 could fuel further price movement
- Technical support identified at $3.21, with resistance at $3.38 and $3.54
- TON recently rallied for three days since May 8 before momentum slowed
Toncoin (TON) is showing signs of a potential breakout after trading in a bullish pennant pattern. The cryptocurrency has been consolidating following a three-day rally that began on May 8, 2025, with prices now hovering around the $3.50 resistance level.
The current price action suggests a possible continuation of TON’s upward trend, though momentum appears to be slowing. Bulls are currently struggling to push past the key $3.50 resistance zone.
On-chain data presents an interesting development. Large transactions have spiked by 84%, reaching $6.12 billion. This increase in whale activity often precedes major price movements and suggests that key market players may be positioning themselves for a breakout.
Adding to the bullish case is liquidation data from Coinglass. A significant liquidation cluster worth over $999,000 sits at the $3.66 level. This cluster could act as a price magnet if TON breaks above current resistance.
Short-term technical analysis shows TON trading near the midline of the Bollinger Bands. Support has formed around $3.21, which aligns with the lower Bollinger Band and the 100-period simple moving average.

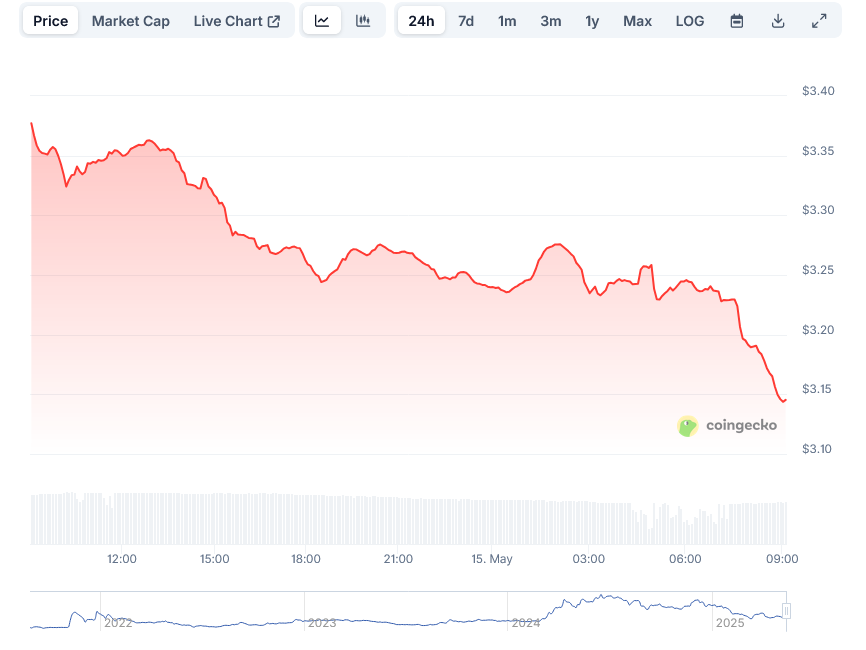
TON Price
Technical Indicators Point to Consolidation
The Relative Strength Index (RSI) has pulled back from overbought territory and now sits at 47.64. This decline indicates that buying pressure has reduced after the recent rally.
Meanwhile, the Moving Average Convergence Divergence (MACD) shows signs of flattening momentum. The MACD line (0.0125) remains above the signal line (-0.0284), but the histogram is leveling off, suggesting a potential shift toward sideways movement.
Volume has decreased compared to the early-May rally. This reduction in volume may limit price volatility in the near term unless new market catalysts emerge.
Despite this consolidation, TON continues to trade above both the 100 and 200-period SMAs, which is generally considered a bullish signal for longer-term trends.
For traders watching TON’s next move, key levels to monitor include the $3.38 and $3.54 resistance points. A clear break above $3.54 could trigger renewed buying interest.
On the downside, support at $3.21 will be critical. Failure to hold this level might expose TON to further declines toward the $3.10 level, which coincides with the 200-period SMA.
The current tight trading range suggests that TON is at a decision point. The cryptocurrency needs either a strong catalyst or increased buying pressure to overcome resistance at $3.50.
If TON manages to break above this level, the next target becomes the $3.66 area, where the large liquidation cluster is located. A move above this point could trigger a cascade of liquidations as short positions are forced to cover.
The most recent data shows TON trading at $3.29 as of May 14, 2025, maintaining its position above key support levels while momentum indicators suggest a cautious approach in the near term.


