


 Price Prediction & Analysis: Consolidating After Recent Run, What’s next?")
TLDR
- TD Sequential indicator has flashed a sell signal as PEPE approaches resistance at the 1.272 Fibonacci extension
- RSI has dropped to 68.82 from above 75, indicating reduced buying pressure
- MACD histogram is contracting, suggesting waning momentum
- PEPE is currently trading at $0.000014, down 1.78% over 24 hours
- The cryptocurrency has a market cap of approximately $5.71 billion, ranking 25th overall
PEPE, the popular meme cryptocurrency, appears to be losing momentum after a strong rally in mid-April 2025. Several technical indicators now point to a potential short-term pullback or consolidation phase.
The TD Sequential indicator, a tool used to identify potential price reversals, has recently flashed a sell signal on PEPE’s daily chart. This indicator has previously provided accurate predictions for PEPE price movements.
The sell signal comes as PEPE approaches resistance at the 1.272 Fibonacci extension level, approximately $0.00000168.
Trading analyst Ali Martinez highlighted this development on social media platform X, noting the appearance of a red “1” indicator and a downward-pointing arrow on the daily chart.
The TD Sequential has been spot-on with $PEPE daily chart. And it’s now flashing a sell signal, suggesting a potential pullback ahead. pic.twitter.com/3aTrPUHI4A
— Ali (@ali_charts) May 15, 2025
Historical Pattern Recognition
The current technical setup follows a structured advance from the $0.00000045 level in April. PEPE has followed a series of Fibonacci retracement moves throughout its recent price action.
After hitting resistance at the 0.618 level (around $0.00000103), PEPE pulled back before finding support and regaining strength.

A bounce from the 0.382 support level led to another breakout above the 1.0 Fibonacci extension near $0.00000134. The token later peaked at approximately $0.00000168 near the 1.272 extension.
This pattern of peaks and valleys has been clearly marked by the TD Sequential indicator. On May 2nd, a green signal (A13) correctly predicted a price increase. A red “1” appeared on April 27th, indicating a temporary peak followed by a decline.
The day after this pullback, a green “1” appeared on May 5th, preceding a strong price growth period. The most recent red “1” appeared on May 14th, suggesting another potential drop.
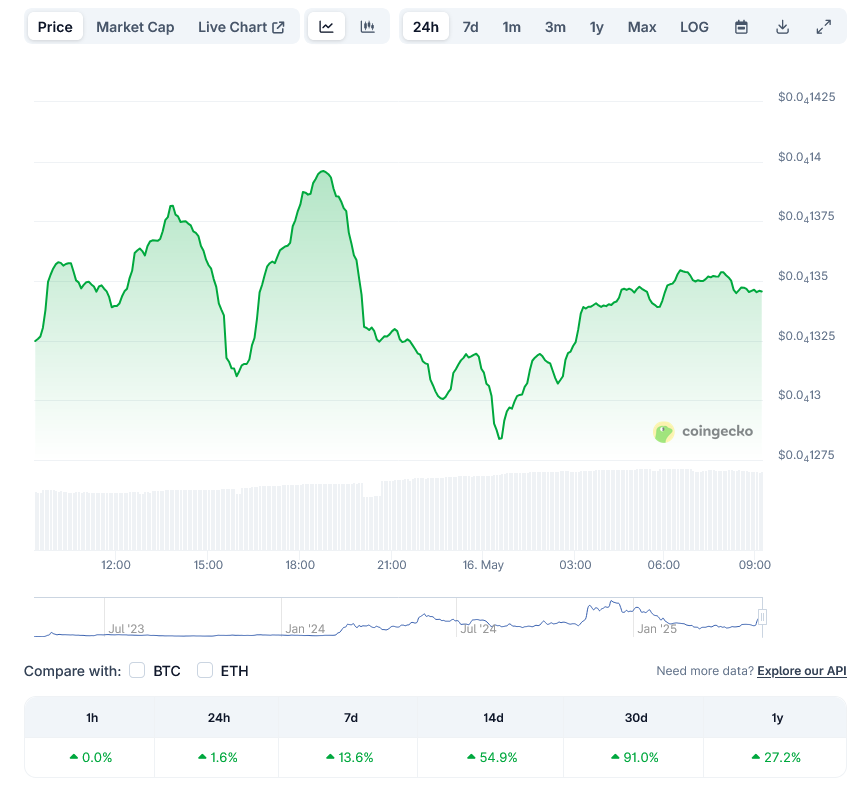
PEPE Price
Supporting Technical Evidence
Multiple momentum indicators are confirming the slowing price momentum for PEPE.
The Relative Strength Index (RSI), which had previously surged above 75 during the rally, has now fallen to 68.82. This represents a drop below the overbought zone of 70, indicating easing buying pressure.
While these RSI levels still reflect bullish territory, the downward shift suggests that the strength behind PEPE’s upward movement may be softening. The 14-day average RSI stands at 67.23.
The Moving Average Convergence Divergence (MACD) chart provides further evidence of the slowing momentum. Although the MACD line remains above the signal line (0.00000155 versus 0.00000114), the histogram bars have started to contract.
This reduction in the histogram suggests weakening trend strength and raises the possibility of a bearish crossover if the MACD line falls below the signal line.
PEPE is currently trading at $0.000014, reflecting a 1.78% decline over the past 24 hours. Its market capitalization stands at approximately $5.71 billion, ranking it 25th overall in the cryptocurrency market.
The 24-hour trading volume for PEPE exceeds $1.16 billion, showing continued interest in the meme cryptocurrency despite the warning signs.
Traders who currently hold PEPE positions may want to consider securing recent profits or setting stop-loss orders given the emerging technical signals. The cryptocurrency is trading above the 1.618 Fibonacci extension, which serves as a major resistance point.
While these technical indicators don’t guarantee a price drop, they suggest caution for traders and investors in the near term.